

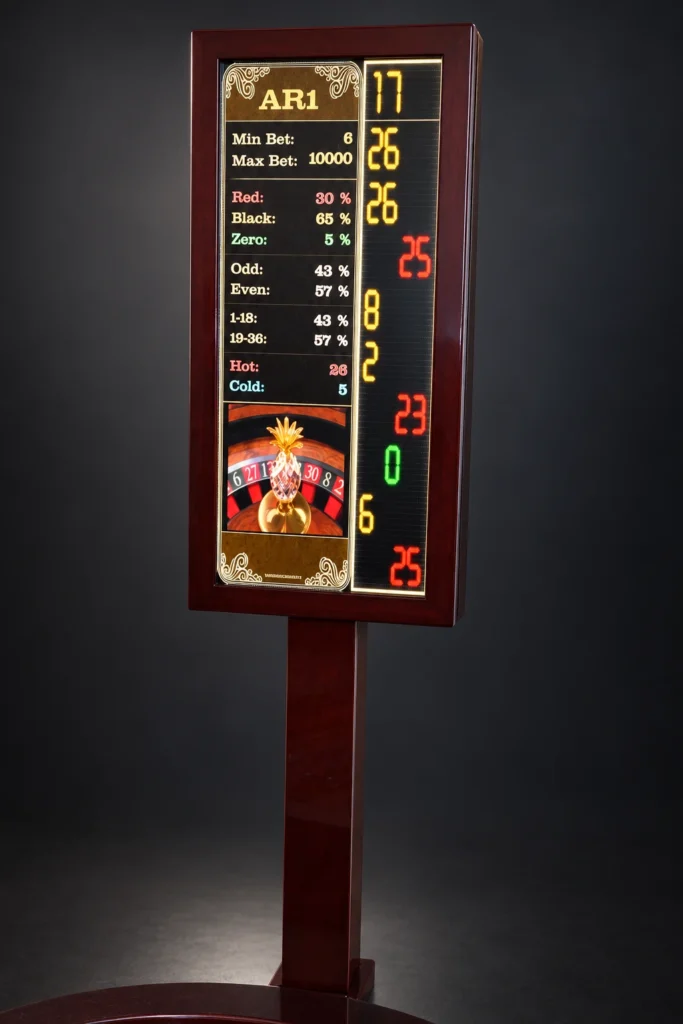
Wheel statistics answer a question that is usually settled by eye on the floor: how is this particular wheel behaving? The system accumulates winning numbers and shows not impressions but the real occurrence percentage of each number over a chosen period.
What the system shows
Occurrence percentages
The real percentage for each number over a period — for one wheel or for all of them at once.
Charts
Bar and pie charts: the spread across numbers, colours and wheel sectors is visible at a glance.
Real-time monitoring
The state of the wheel updates as play goes on — there is no need to wait for the shift to close.
Return percentage
The critical return percentage is calculated for every bet type, not only for the table total.
Why it matters
A mechanical wheel wears unevenly. A shifted sector, a damaged diamond or a tilted table produce a bias that only shows up in statistics — and that a prepared player can exploit. The system reveals the bias before it turns into a loss.
The second purpose is controlling the return percentage. If the return on some bet type moves past its critical boundary, that shows as its own line rather than dissolving into the table’s overall result.
Where the data comes from
Winning numbers arrive from the display’s laser sensor and are saved to the database automatically. No manual entry is involved, so every spin reaches the statistics — not only those somebody managed to write down.
Statistics work together with the American roulette display: one sensor serves both the numbers shown to players and the data gathered for analysis.